Displays each mapped label alongside its color swatch and hexadecimal code.
Examples
cell_map <- sc_color_map(c("B", "T", "NK"))
sc_color_map_plot(cell_map)
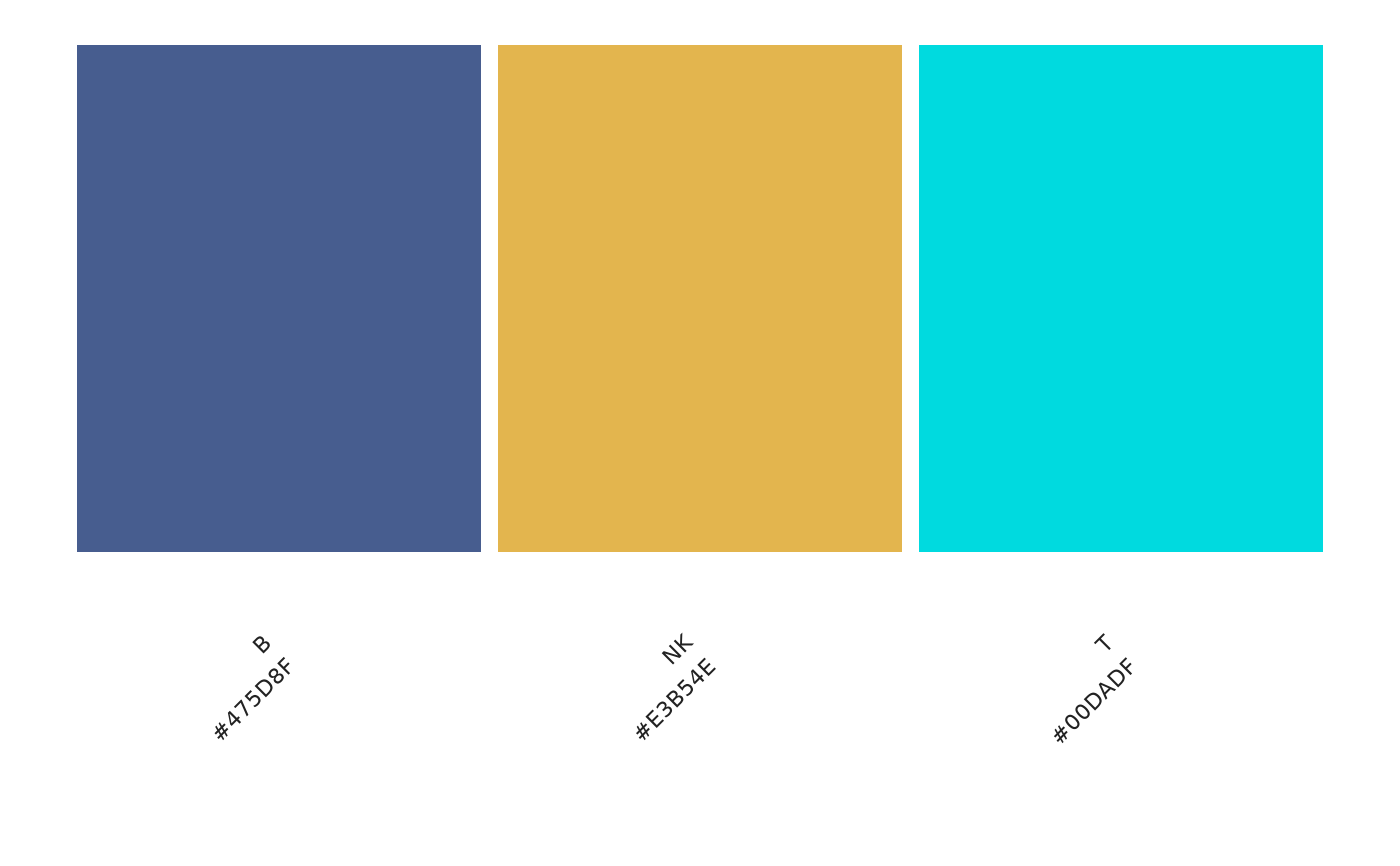
Displays each mapped label alongside its color swatch and hexadecimal code.
cell_map <- sc_color_map(c("B", "T", "NK"))
sc_color_map_plot(cell_map)