Plot palette swatches or dense point previews
Usage
sc_palette_plot(
  x,
  n = NULL,
  view = c("swatch", "points", "both"),
  background = c("light", "dark"),
  cvd = c("none", "deutan", "protan", "tritan"),
  labels = TRUE,
  codes = FALSE
)
Arguments
- x
Palette ID, color vector, or sc_color_map.
- n
Optional number of colors for a palette ID.
- view
Swatches, points, or both.
- background
Light or dark background.
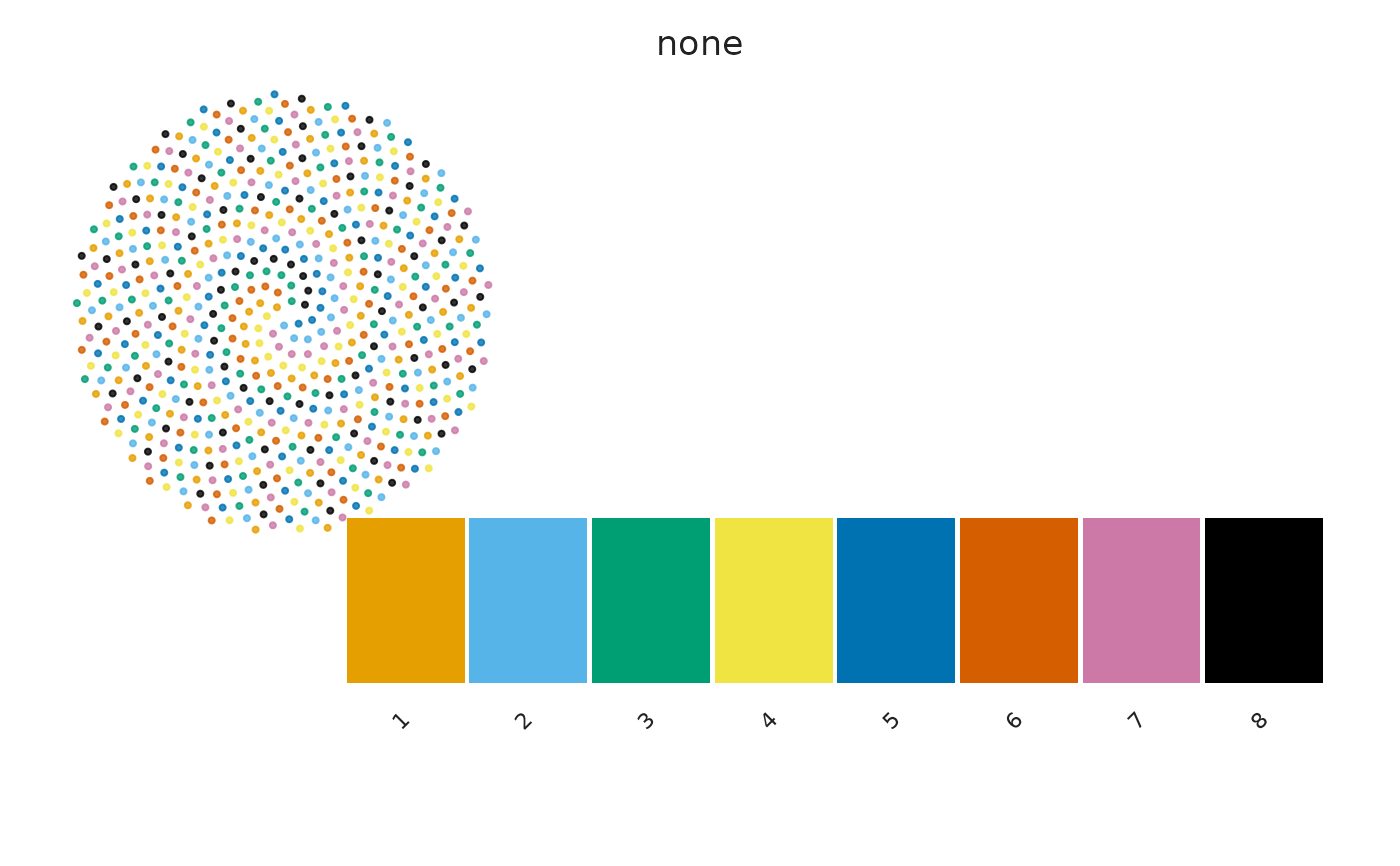
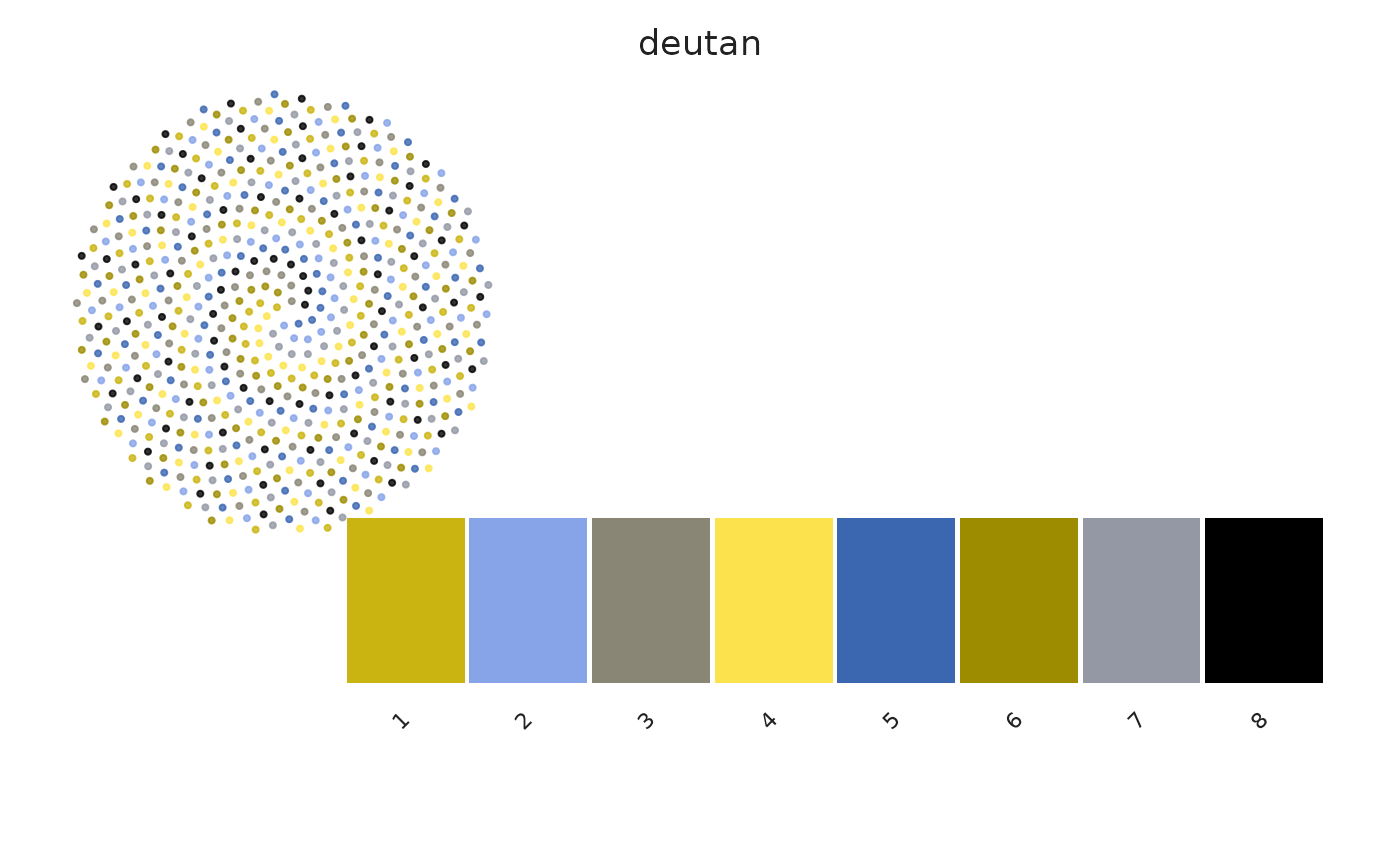
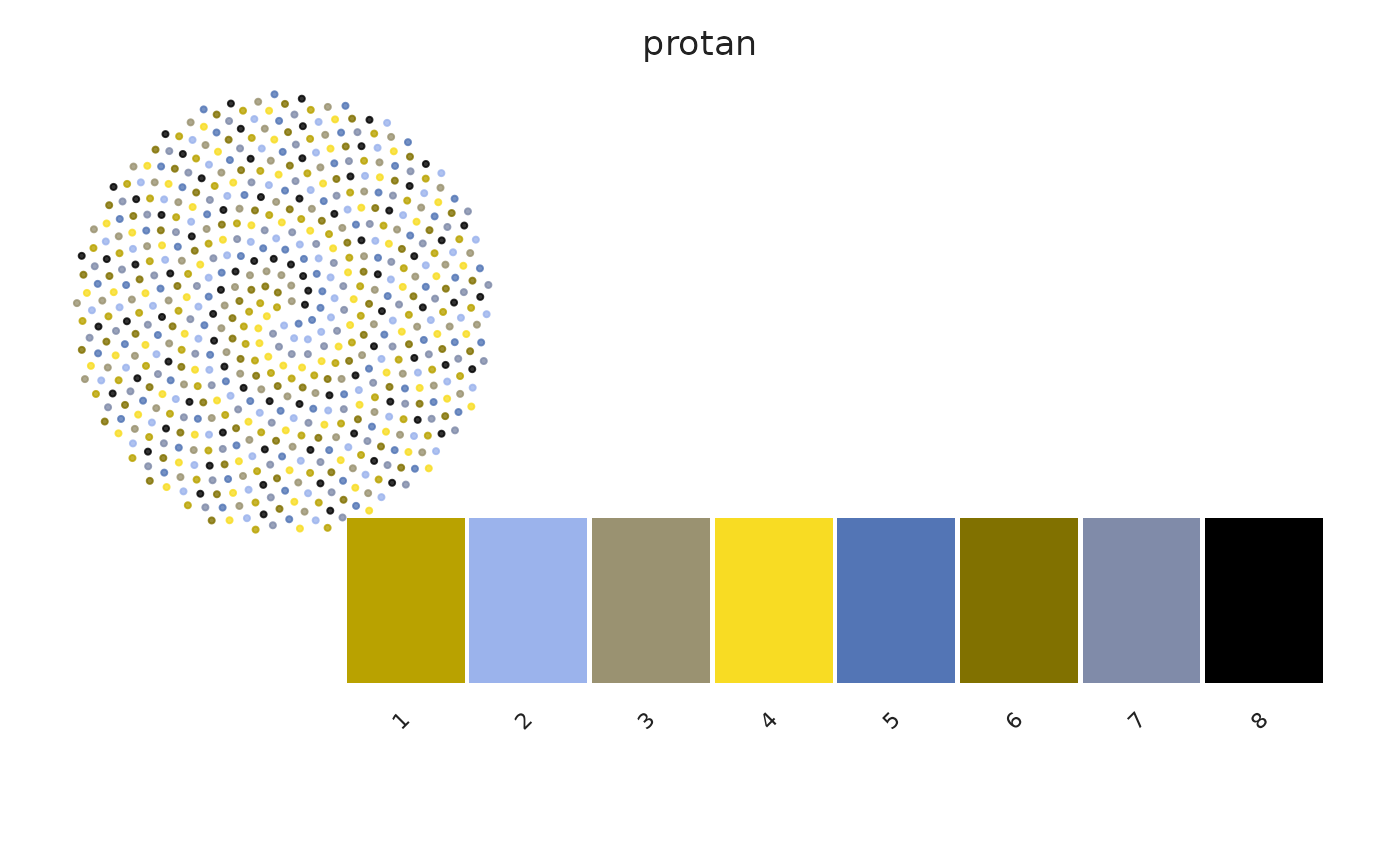
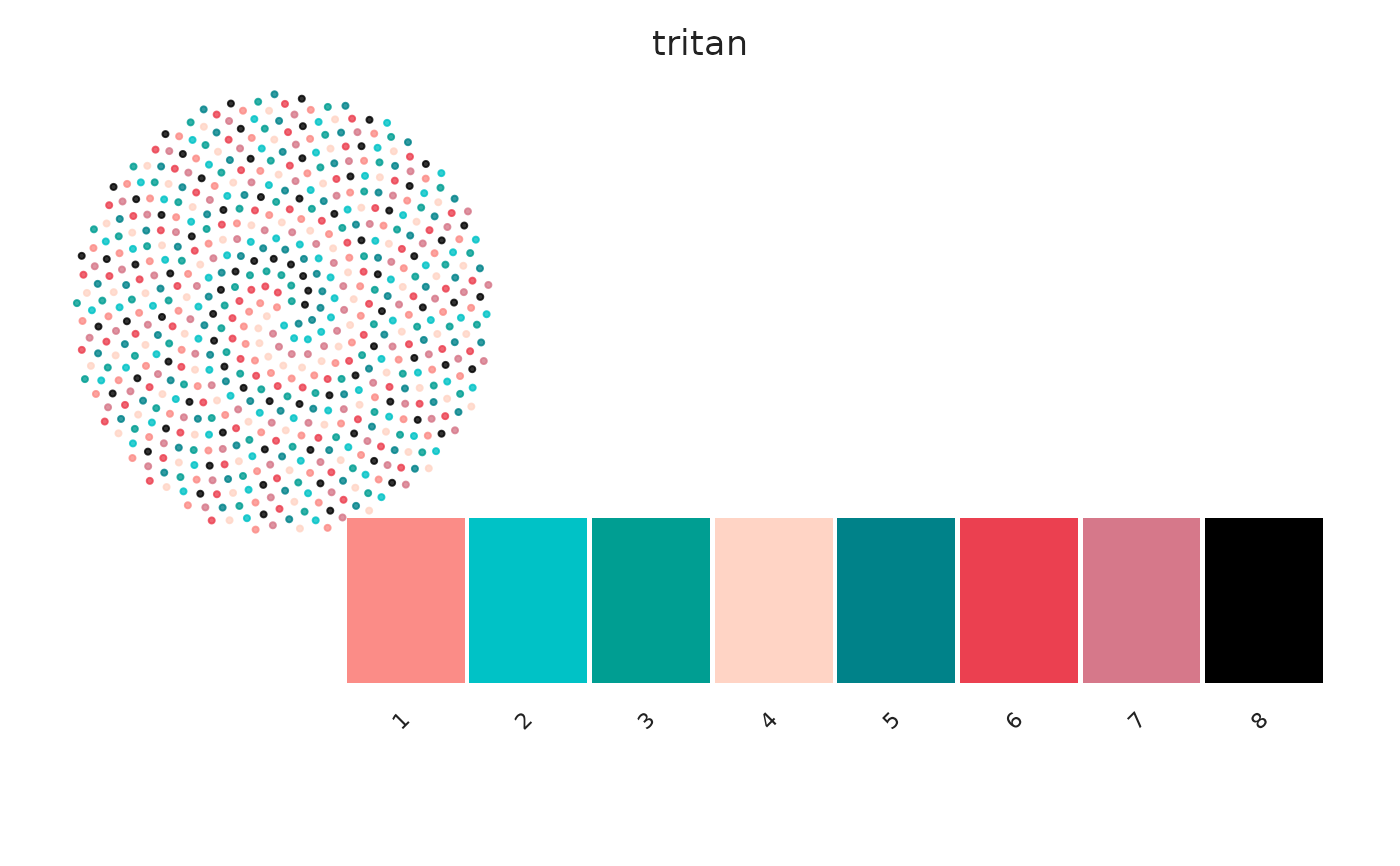
- cvd
One or more vision simulations.
- labels
Label swatches.
- codes
Label swatches with their hexadecimal color codes.
Value
A ggplot object for one CVD view, otherwise a named list of plots.
Examples
sc_palette_plot("okabe_ito", view = "both")
#> $none
 #>
#> $deutan
#>
#> $deutan
 #>
#> $protan
#>
#> $protan
 #>
#> $tritan
#>
#> $tritan
 #>
#>