19 Goodness of fit in R
As a data scientist, occasionally, you receive a dataset and you would like to know what is the generative distribution for that dataset. In this post, I aim to show how we can answer that question in R. To do that let’s make an arbitrary dataset that we sample from a Gamma distribution. To make the problem a little more interesting, let add Gaussian noise to simulate measurement noise:
num_of_samples = 1000
x <- rgamma(num_of_samples, shape = 10, scale = 3)
x <- x + rnorm(length(x), mean=0, sd = .1)
Basically, the process of finding the right distribution for a set of data can be broken down into four steps:
Visualization. plot the histogram of data
Guess what distribution would fit to the data the best
Use some statistical test for goodness of fit
Repeat 2 and 3 if measure of goodness is not satisfactory
The first task is fairly simple. In R, we can use hist to plot the histogram of a vector of data.
p1 <- hist(x,breaks=50, include.lowest=FALSE, right=FALSE)## Warning in hist.default(x, breaks = 50, include.lowest = FALSE, right =
## FALSE): 'include.lowest' ignored as 'breaks' is not a vector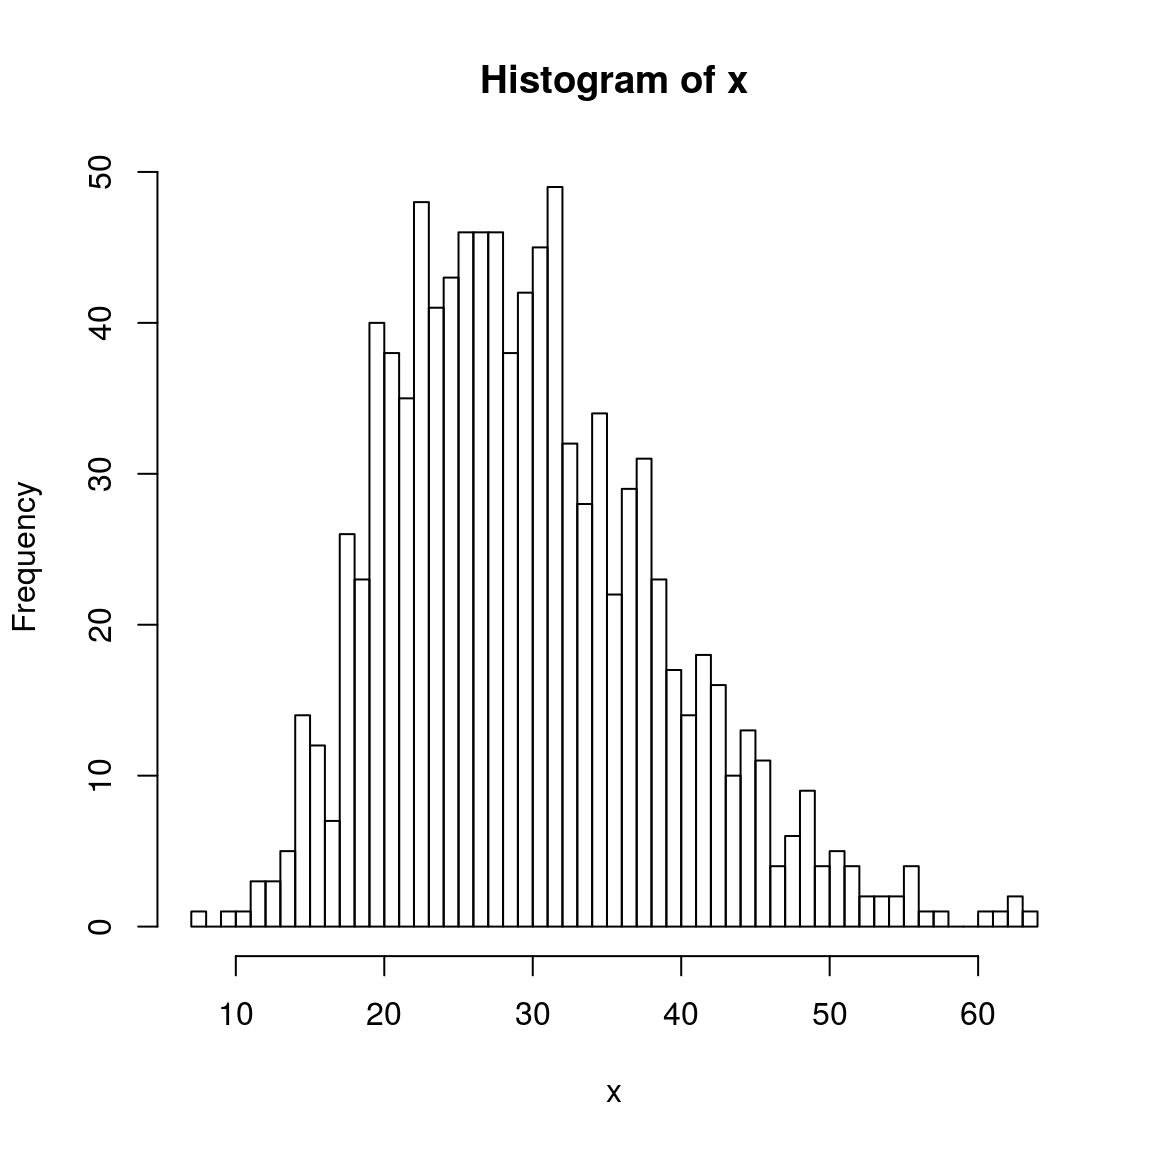
The plot above shows the histogram of the above dataset:
The second task is a little bit tricky. It is mainly based on your experience and your knowledge of statistical distribution. Since we created the dataset ourselves, it is easy (surprisingly!) to guess the distribution. Let assume we know that the distribution is a Gamma distribution with shape 10 and scale 3.
The third task is to do some statistical testing to see if data is actually driven from the parametric distribution. These tests are call Goodness of fit. There are three well-known and widely use goodness of fit tests that also have nice package in R.
- Chi Square test
- Kolmogorov–Smirnov test
- Cramér–von Mises criterion
All of the above tests are for statistical null hypothesis testing. For goodness of fit we have the following hypothesis:
H0 = The data is consistent with a specified reference distribution.
H1 = The data is NOT consistent with a specified reference distribution
19.1 Reference
Goodness of fit test in R: https://www.r-bloggers.com/goodness-of-fit-test-in-r/